- Fresh Trade Ideas
- Posts
- Sunday Setups - 11/3
Sunday Setups - 11/3
Election + Fed....What could go wrong (right)?

Happy Sunday,
To make your Monday more enjoyable, we’ve prepared some Fresh Trade Ideas for you. They go nicely with a freshly squeezed glass of lemonade!
What is the Sunday Setup?
It’s a short review of the market, trades from last week and a detailed overview of trade ideas for this week. Build your trading strategy for the week in the time it takes to finish a glass of lemonade.
Before we get started, a friendly reminder that if you upgrade to Full Access, you’ll unlock instant access to:
📈 All of our Premium Trade Ideas.
💾 Full access to all trade commentary, trade ideas, and strategies (past & present)
⏰ Real-time trade updates with our trade tracker.
📗 Learn how to find the best setups on your own.
❓Ask any questions about setups, the market, or options.
And much more.
Alright, is that sugar kicking in? Let’s find some edge!
Market Review
Before we dive in to the individual trades that I am looking to take, I want to do a quick review of where the markets stand. Understanding the overall market trend will help guide us with how we approach these trades.
We finally got a bit of a sell-off this past week…on the spookiest day of the year, nonetheless!
SPX chopped around the 8 EMA for the first part of the week, and sold off hard Thursday, right into $5700, where there was a bit of support. From there, the indices had a bit of a bounce that was sold off Friday.

SPX Hourly
The mag7 earnings releases led to the larger move on Thursday, with AMZN, MSFT, & META all reporting after the bell on 10/30. They all moved lower.
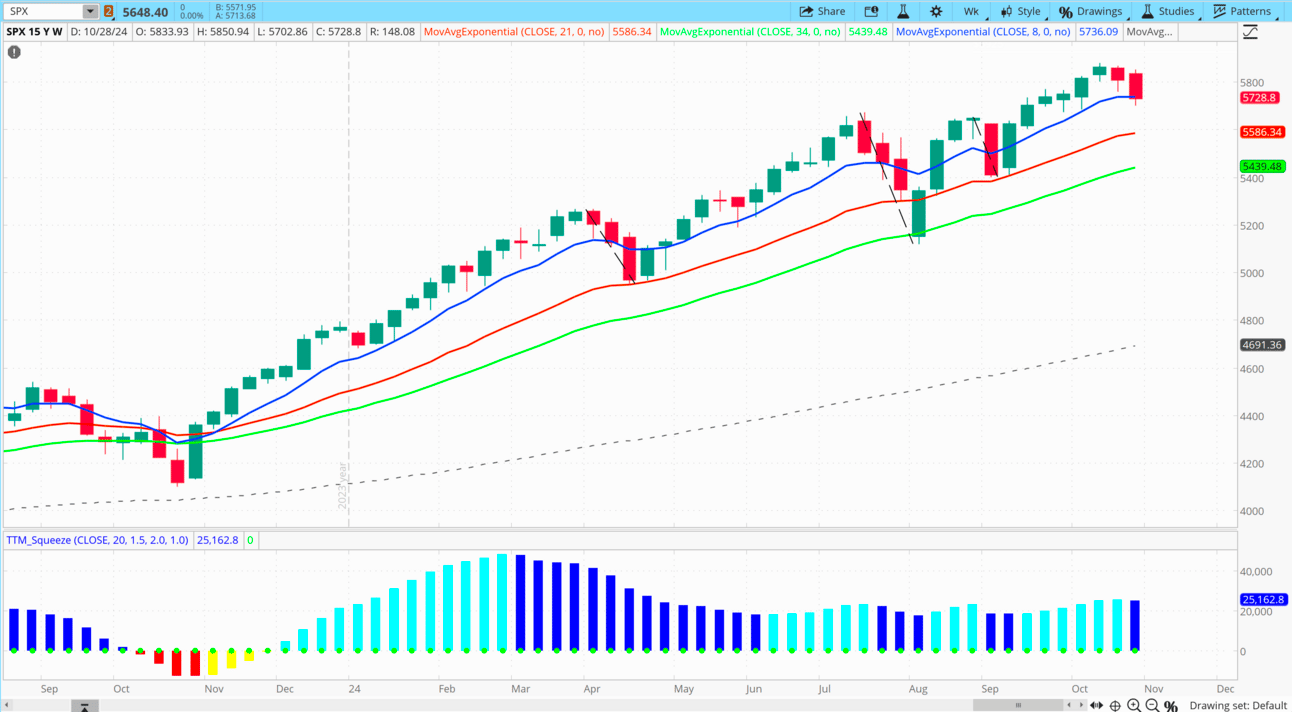
While this felt, and looks, quite bearish, this was a move just below the 8 EMA on the Weekly chart of the SPX. So, it does not change the overall bullish trend we are in.

SPX Weekly
Though, the million-dollar question….where do we go from here?
From a daily perspective, we have had 2 daily closes below the 21 and 34 EMAs. So, short term, that puts my focus on the bearish side of the market.
However, on a weekly chart, the market is still very bullish - the shorter EMAs are stacked higher than the longer EMAs.
So, while we may see a bit more downside, I think the lowest we go in the near-term is the 21 EMA on the weekly chart. This would be ~$5600 in the SPX (100 pts lower).
If that were to come to fruition, I am a buyer with an upside target of $5920 and potentially $6000 by the end of the year.
We are also at a pretty critical level on the /ES in terms of volume. There was a lot of volume between 5740 and 5800. So, there could be buyers here.

/ES Volume Profile on Daily
However…..we have a couple potential catalysts this week that could really accelerate things in either direction.
Tuesday is election day!
So, I think it’s wise to stay light into this, as the outcome could accelerate price movement similar to an earnings release.
Then, we have the Fed on Thursday. They’re expected to lower rates another 25 basis points. I think the election might overshadow this, but important to keep on the radar!
At the end of the day, I’ll let price be my guide.
If the SPX can regain the EMAs on a daily close, I will look long. Specifically, if it closes above the high of 10/31 ($5775), I will look to enter long. This would be a close above the high of the low bar, which I note as a buy signal.
On the other hand, if we get another close below the low of this week ($5703), I’ll look short into the 21 EMA on the weekly chart. I would wait to enter until price rallied into the falling 8 EMA on the daily chart. My stop would be a daily close above the EMAs.
Pretty straightforward right?
What you might see is a dip below this week’s low to stop out longs and then ultimately head higher. So, watch out for that.
At the end of the day, I’m still focused on the long side for strong names that follow my rules:
bullish structure, defined as the 8 EMA > 21 EMA > 34 EMA on both the daily and weekly charts
A squeeze, which increases the probability of an increase in volatility and a greater than expected move in the near future
Prices are near all time highs, reducing resistance at higher prices
So, despite all the noise you will hear this week about the election, let’s focus on our trading plan - that keeps working.
While it may feel like a tricky place in the market, the good thing about these levels is that there are clear triggers for long or short based on the daily close in the SPX (see above).
The near-term trend will be much more evident if we get a clear winner Tuesday night.
The betting markets have Trump winning. I think that we might see a rally if there is confirmation of that, as the uncertainty lessens. More uncertainty = more volatility the majority of the time.
If there is no clear winner, we might sell off or see a bit more chop.
I don’t want to get too deep into politics, but at the end of the day, the Nasdaq and the Mag7 all still look extremely bullish. So, if I had to pick a direction, I think bullish is in our favor.
Look at the chart of the Nasdaq futures (/NQ):

/NQ Daily Chart
If that daily squeeze fires long, I’m looking up to $21,000.
Ok, now the Mag7:
TSLA has a bullish structure (8 > 21 > 34 EMAs) and a Monthly squeeze.
GOOGL has a bullish structure and a Daily squeeze that fired long.
NVDA has a bullish structure and closed above the 21 Daily EMA.
MSFT looks bearish on the daily, but bullish on the weekly.
META has a bullish structure and a daily squeeze.
NFLX has bullish structure and a 4 hour squeeze.
AAPL has a bullish structure on the weekly and a weekly squeeze.
Hard to fight these bullish charts, despite the increase in volatility this week…
Net - I am bullish, but open to a short-term drop into the weekly 21 EMA on the major indices (SPX / NDX). Price will be my trigger.
At the end of the day (how many times am I going to use this?), I’m not looking for everything to fall apart. So, I’m still focused heavily on the long side, and any additional selling will offer better entries for strong names.
Ok, here’s what I’m trading this week.
This week’s Trade Ideas
1.) NOW Long

NOW Daily Chart
Reasoning:
Bullish Trend (8 EMA > 21 EMA > 34 EMA) on the daily and weekly charts - trading with the trend
Squeeze on the Daily chart, which increase the probability for a bigger move over the next few weeks.
Just about 4% off of all time highs - less resistance overhead.
My Levels:
Entry Zone: $914 - $940
34 EMA (green line in daily chart) up to the 8 EMA (blue line in the daily chart)
Entries priced at 21 EMA.
Targets: $1000
T1: $1000
Confluence of 127.2% fibonacci extension from most recent swing high to low and the 161.8% fibonacci extension from prior swing high to low.
NOW Options Strategies
**exits are theoretically priced for 2 weeks out, but the price of the underlying is the primary trigger for taking the trade off. In other words, if price gets close to $1000, I look to sell the calls as close to the MID price as possible.
Call Debit Spread (Buying the 950 strike & selling the 1000 strike, 47 Days to Expiration)
Entry: BUY +1 VERTICAL NOW 100 20 DEC 24 950/1000 CALL @15.00 LMT
Exit T1: SELL -1 VERTICAL NOW 100 20 DEC 24 950/1000 CALL @30.00 LMT
2.) PH Long

PH Daily Chart
Reasoning:
Bullish Trend (8 EMA > 21 EMA > 34 EMA) on the daily and weekly charts - trading with the trend
Squeeze on the daily chart, which increase the probability for a bigger move in the near future.
Just about $10 off of life-time highs, so potential for that to be breached with little resistance.
My Levels:
Entry Zone: $623 - $630
34 EMA (green line in daily chart) up to the 8 EMA (blue line in the daily chart)
Entries priced at $630 (round number near the 8 & 21 EMAs).
Targets: $667 - $690
T1: $667
161.8% extension from most recent swing high to low.
T2: $690
Cluster of fibonacci extensions from prior swings.
PH Options Strategies
**reminder: exits are theoretically priced for two weeks out, but the price of the underlying is the primary trigger for taking the trade off.
Long Calls (55 Delta, $600 Strike, 47 Days to Expiration)
Entry: BUY +1 PH 100 20 DEC 24 600 CALL @50.00 LMT
Exit T1: SELL -1 PH 100 20 DEC 24 600 CALL @68.00 LMT
Exit T2: SELL -1 PH 100 20 DEC 24 600 CALL @90.00 LMT
3.) C Long

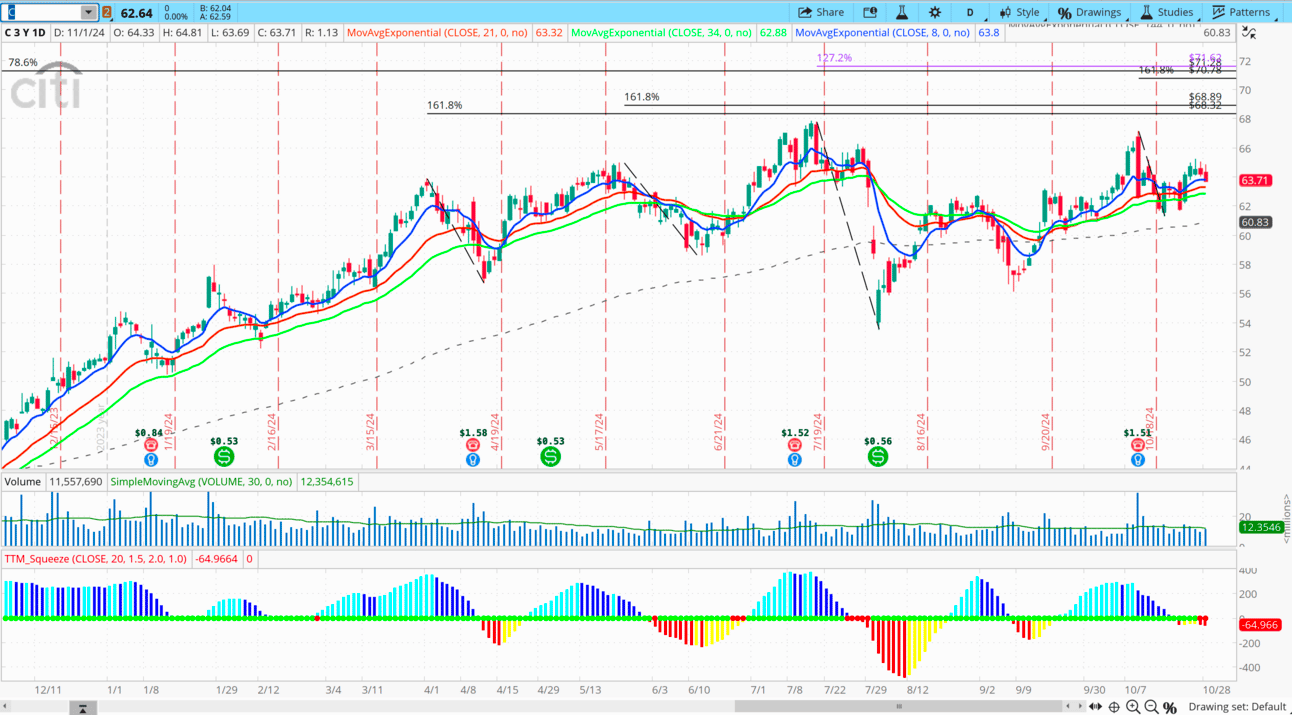
C Daily Chart

C Weekly Chart
Reasoning:
Bullish Trend (8 EMA > 21 EMA > 34 EMA) on the daily and weekly charts - trading with the trend
Squeeze on the daily and weekly charts, which increase the probability for a bigger move in the near future.
My Levels:
Entry Zone: $62.8 - $63.8
34 EMA (green line in daily chart) up to the 8 EMA (blue line in the daily chart)
Entries priced at current levels - this is in the buy zone.
Targets: $69 - $71
T1: $69
T2: $71
Both are clusters of fibonacci extensions from prior swings.
C Options Strategies
**reminder: exits are theoretically priced for two weeks out, but the price of the underlying is the primary trigger for taking the trade off - meaning, if the stock price reaches $69, you sell the options as close to the active MID price as possible.
Long Calls (60 Delta, $60 Strike Price, 47 Days to Expiration)
Entry: BUY +1 C 100 20 DEC 24 60 CALL @5.00 LMT
Exit T1: SELL -1 C 100 20 DEC 24 60 CALL @9.00 LMT
Exit T2: SELL -1 C 100 20 DEC 24 60 CALL @11.00 LMT
I’ll keep you posted on any trades I take!
Open Trades Review
Week of 9/22 Trade Ideas
ADI (10/8 entry)
Waiting for squeeze to play out - might need to cut this one loose with the two closes below the 34 EMA. It’s not looking great right now. At this point, most of the credit is gone, so I’ll likely just hold and see if we get a reversal higher. Technically, it has broken the rules to hold.
Week of 10/6 Trade Ideas
ED (CLOSED)
I cut this looks for about a scratch. Doesn’t look like it’s getting follow through with two closes below the 21 EMA.
Week of 10/13 Trade Ideas
WMT (10/14 entry)
Holding half for $86. Still looks great.
TSLA (10/14 entry)
This still looks good. It pulled back to the 8 EMA, which probably another buying opportunity. We have to be patient with these longer-dated options. Looking for $300.
Week of 10/20 Trade Ideas
BOX (10/22 entry)
Taking it’s time - still waiting for this to shift positive. Holding for now.
Week of 10/27 Trade Ideas
COST (10/28 entry)
Great entry at the cluster of EMAs. Not off to a great start, trading eblow the EMAs, but the squeeze is still in tact. If it can’t regain the EMAs this week, I’ll cut it loose.
That’s it, that’s all. Let me know what you thought of this week’s Sunday Setups!